
Finance Data Analyst Average Salary in London 2026
How much money does a person working as Finance Data Analyst make in London?
LOW
45,200
GBP AVERAGE
98,200
GBP HIGH
156,000
GBP
A person working as Finance Data Analyst in London typically earns around 98,200 GBP. Salaries range from 45,200 GBP (lowest) to 156,000 GBP (highest).
Salary Variance
This is the average salary including housing, transport, and other benefits. Finance Data Analyst salaries in London vary drastically based on experience, skills, gender, or location. Below you will find a detailed breakdown based on many different criteria.
Finance Data Analyst Pay Scale and Salaries in London
Median Salary, maximum and minimum salary, minimum wage, starting salary, and the salary range
Salary Range, Minimum Wage, and Starting Salary
Salaries for the position Finance Data Analyst in London range from 45,200 GBP (starting salary) to 156,000 GBP (maximum salary). It should be noted that the given figure is not the legally mandated minimum wage; rather, it represents the lowest figure reported in a salary survey that included thousands of participants and professionals from all regions of the country.
Median Salary
With a median salary of 93,800 GBP, half of the professionals who work as Finance Data Analyst in London earn less than this amount, and the other half earn more. The median salary denotes the middle value of salaries. Ideally, you would want to belong to the group earning more than the median salary, located on the right side of the salary distribution graph.
Percentiles and Salary Scale
The median is closely associated with two other values known as the 25th and 75th percentiles. By examining the salary distribution chart, it can be determined that 25% of professionals employed as Finance Data Analyst in London earn less than 75,600 GBP, while 75% earn more. Similarly, the chart shows that 75% earn less than 108,000 GBP while 25% earn more.
Pay Scale Structure
To provide a better understanding of expected salaries, we categorized the frequently occurring salaries into different ranges. This approach provides a more precise representation of salary distribution for the job title Finance Data Analyst in London compared to simply calculating the average. The majority of reported salaries, approximately 65%, fall within the range of 56,200 GBP to 81,600 GBP. About 20% of salaries are below the 56,200 GBP mark, while 10% fall within the range of 81,600 GBP to 93,100 GBP. Only 5% of individuals have salaries exceeding 93,100 GBP.

Salary Comparison by Years of Experience / Finance Data Analyst / London
How do experience and age affect pay?
| 0 - 2 Years | 51,300 GBP | |
| 2 - 5 Years | +34% | 68,400 GBP |
| 5 - 10 Years | +48% | 101,000 GBP |
| 10 - 15 Years | +22% | 123,000 GBP |
| 15 - 20 Years | +9% | 134,000 GBP |
| 20+ Years | +8% | 146,000 GBP |

The experience level is the most important factor in determining the salary. Naturally, the more years of experience the higher the wage. We broke down salaries by experience level for people working as Finance Data Analyst and this is what we found.
Employees with less than two years of experience earn approximately 51,300 GBP.
While someone with an experience level between two and five years is expected to earn 68,400 GBP, 34% more than someone with less than two year's experience.
Moving forward, an experience level between five and ten years lands a salary of 101,000 GBP, 48% more than someone with two to five years of experience.
Additionally, professionals whose expertise span anywhere between ten and fifteen years get a salary equivalent to 123,000 GBP, 22% more than someone with five to ten years of experience.
If the experience level is between fifteen and twenty years, then the expected wage is 134,000 GBP, 9% more than someone with ten to fifteen years of experience.
Lastly, employees with more than twenty years of professional experience get a salary of 146,000 GBP, 8% more than people with fifteen to twenty years of experience.
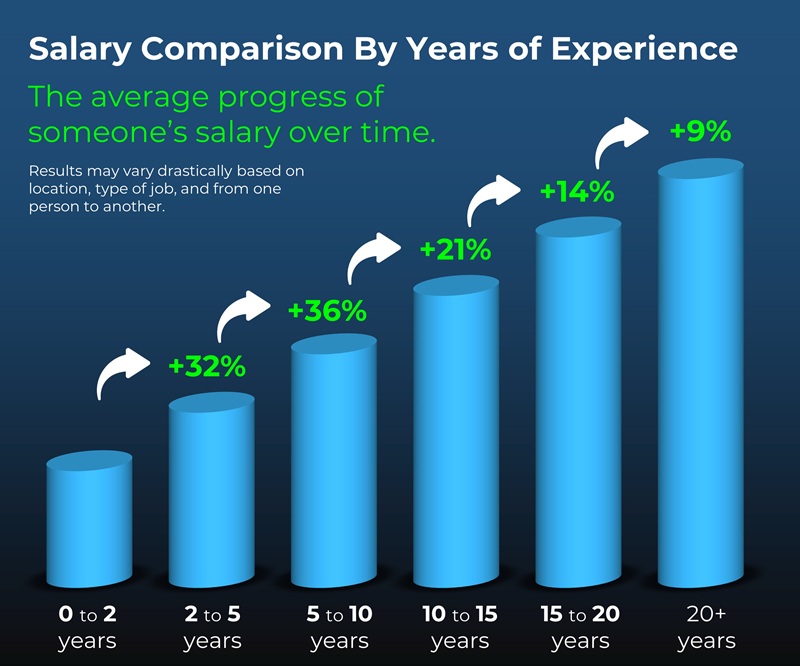
Typical Salary Progress for Most Careers
Salary Comparison By Education / Finance Data Analyst / London
How do education levels affect salaries?
Displayed below is the average salary variance between different education levels of professionals working as Finance Data Analyst.
| High School | 46,300 GBP | |
| Certificate or Diploma | +24% | 57,400 GBP |
| Bachelor's Degree | +39% | 79,500 GBP |
| Master's Degree | +63% | 129,000 GBP |
| PhD | +20% | 155,000 GBP |

We all know that higher education equals a bigger salary, but how much more money can a degree add to your income? We broke down salaries by education level for the position Finance Data Analyst in order to make a comparison.
Level 1: High School
Employees at this education level have an average salary of 46,300 GBP.
Level 2: Certificate or Diploma
At this level, the average salary becomes 57,400 GBP, 24% more than the previous level.
Level 3: Bachelor's Degree
At this level, the average salary becomes 79,500 GBP, 39% more than the previous level.
Level 4: Master's Degree
At this level, the average salary becomes 129,000 GBP, 63% more than the previous level.
Level 5: PhD
At this level, the average salary becomes 155,000 GBP, 20% more than the previous level.
Is a Master's degree or an MBA worth it? Should you pursue higher education?
A Master's degree program or any post-graduate program in United Kingdom costs anywhere from 29,700 GBP to 89,100 GBP and lasts approximately two years. That is quite an investment.
You can't really expect any salary increases during the study period, assuming you already have a job. In most cases, a salary review is conducted once education is completed and the degree has been attained.
Many people pursue higher education as a tactic to switch to a higher-paying job. The numbers seem to support the theory. The average increase in compensation while changing jobs is approximately 10% more than the customary salary increment.
If you can afford the costs of higher education, the return on investment is definitely worth it. You should be able to recover the costs in roughly a year or so.
Typical Salary Difference by Education for Most Careers

Salary and Compensation Comparison By Gender / Finance Data Analyst / London

Though gender should not have an effect on pay, in reality, it does. So who gets paid more: men or women? For the people who work as Finance Data Analyst in United Kingdom, the average difference between the salary of male and female employees is 5%.
| Male | 80,800 GBP | |
| Female | -5% | 77,100 GBP |
Average Annual Salary Increment Percentage / Finance Data Analyst / London
How much are annual salary increments in London for individuals working as Finance Data Analyst? How often do employees get salary raises?
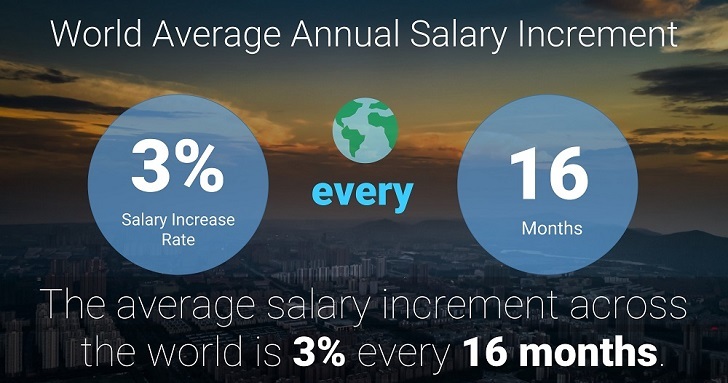
Individuals working as Finance Data Analyst in United Kingdom are likely to observe a salary increase of approximately 12% every 15 months. The national average annual increment for all professions combined is 9% granted to employees every 15 months.

United Kingdom / All Professions
The term Annual Salary Increase usually refers to the increase in 12 calendar month period, but because it is rare that people get their salaries reviewed exactly on the one-year mark, it is more meaningful to know the frequency and the rate at the time of the increase.
How to calculate the salary increment percentage?
The annual salary Increase in a calendar year (12 months) can be easily calculated as follows: Annual Salary Increase = Increase Rate x 12 / Increase Frequency
Worldwide Salary Raises: All Countries and All Jobs
Salary Packages and Schemes
Not all compensation increases are reflected directly in the salary. Some companies offer upgraded packages to their staff instead of cash money. The figures displayed here account only for direct increments to the base salary.
Bonus and Incentive Rates / Finance Data Analyst / United Kingdom
How much and how often are bonuses being awarded?
64% of surveyed staff reported that they haven't received any bonuses or incentives in the previous year while 36% said that they received at least one form of monetary bonus.
Those who got bonuses reported rates ranging from 0% to 4% of their annual salary.
| Received Bonus | 36% | |
| No Bonus | 64% |
Types of Bonuses Considered
Individual Performance-Based BonusesThe most standard form of bonus, where the employee is awarded based on their exceptional performance.
Company Performance BonusesOccasionally, some companies like to celebrate excess earnings and profits with their staff collectively in the form of bonuses that are granted to everyone. The amount of the bonus will probably be different from person to person depending on their role within the organization.
Goal-Based BonusesGranted upon achieving an important goal or milestone.
Holiday / End of Year BonusesThese types of bonuses are given without a reason and usually resemble an appreciation token.
Bonuses Are Not Commissions!
People tend to confuse bonuses with commissions. A commission is a prefixed rate at which someone gets paid for items sold or deals completed while a bonus is in most cases arbitrary and unplanned.
What makes a position worthy of good bonuses and a high salary?
The main two types of jobs | |
| Revenue Generators | Supporting Cast |
Employees that are directly involved in generating revenue or profit for the organization. Their field of expertise usually matches the type of business. | Employees that support and facilitate the work of revenue generators. Their expertise is usually different from that of the core business operations. |
Example: | Example: |
Revenue generators usually get more and higher bonuses, higher salaries, and more frequent salary increments. The reason is quite simple: it is easier to quantify your value to the company in monetary terms when you participate in revenue generation.
Bonus Comparison by Seniority Level
Top management personnel and senior employees naturally exhibit higher bonus rates and frequencies than juniors. This is very predictable due to the inherent responsibilities of being higher in the hierarchy. People in top positions can easily get double or triple bonus rates than employees down the pyramid.
Average Hourly Wage / Finance Data Analyst / London
The average hourly wage (pay per hour) for individuals working as Finance Data Analyst in London is 47 GBP.This is the rate they get paid for every worked hour.
About The Hourly Pay Rate
The hourly wage is the salary paid in one worked hour. Usually, jobs are classified into two categories: salaried jobs and hourly jobs. Salaried jobs pay a fixed amount regardless of the hours worked. Hourly jobs pay per worked hour. To convert salary into hourly wage the above formula is used (assuming 5 working days in a week and 8 working hours per day which is the standard for most jobs). The hourly wage calculation may differ slightly depending on the worked hours per week and the annual vacation allowance. The figures mentioned above are good approximations and are considered to be the standard. One major difference between salaried employees and hourly paid employees is overtime eligibility. Salaried employees are usually exempt from overtime as opposed to hourly paid staff.
What is the minimum hourly rate of pay?
The minimum pay rate per hour for people working as Finance Data Analyst in London is 22 GBP. This is the minimum as per the gathered data in the salary survey not the minimum hourly rate mandated by law.
Salary comparison with similar jobs
| Job Title | Average Salary |
| Accounting and Finance | ||
| Account Examiner | 42,200 GBP |  -57% -57% |
| Account Executive | 77,900 GBP | -21% |
| Accountant | 56,000 GBP | -43% |
| Accounting Analyst | 75,300 GBP | -23% |
| Accounting Assistant | 43,200 GBP | -56% |
| Accounting Associate | 40,500 GBP | -59% |
| Accounting Clerk | 35,400 GBP | -64% |
| Accounting Coordinator | 50,600 GBP | -48% |
| Accounting Head | 123,000 GBP |  +25% +25% |
| Accounting Manager | 129,000 GBP | +31% |
| Accounting Officer | 44,800 GBP | -54% |
| Accounting Specialist | 80,700 GBP | -18% |
| Accounting Supervisor | 83,100 GBP | -15% |
| Accounting Technician | 39,300 GBP | -60% |
| Accounting Unit Controller | 101,000 GBP | +3% |
| Accounts Executive | 73,400 GBP | -25% |
| Accounts Officer | 46,000 GBP | -53% |
| Accounts Payable and Receivable Specialist | 59,600 GBP | -39% |
| Accounts Payable Assistant | 47,200 GBP | -52% |
| Accounts Payable Associate | 55,800 GBP | -43% |
| Accounts Payable Clerk | 44,300 GBP | -55% |
| Accounts Payable Manager | 116,000 GBP | +18% |
| Accounts Receivable Administrator | 82,700 GBP | -16% |
| Accounts Receivable Clerk | 43,000 GBP | -56% |
| Accounts Receivable Financial Analyst | 82,400 GBP | -16% |
| Accounts Receivable Manager | 111,000 GBP | +13% |
| Accounts Receivable Team Leader | 89,100 GBP | -9% |
| Algorithmic Trading Specialist | 103,000 GBP | +5% |
| Assistant Accountant | 42,700 GBP | -57% |
| Assistant Accounting Manager | 111,000 GBP | +13% |
| Assistant Auditor | 57,200 GBP | -42% |
| Assistant Corporate Controller | 76,700 GBP | -22% |
| Assistant Finance Manager | 122,000 GBP | +24% |
| Assistant Financial Controller | 77,900 GBP | -21% |
| Audit Director | 129,000 GBP | +31% |
| Audit Supervisor | 107,000 GBP | +9% |
| Auditing Clerk | 46,000 GBP | -53% |
| Auditing Manager | 127,000 GBP | +29% |
| Billing Clerk | 43,200 GBP | -56% |
| Billing Coordinator | 50,700 GBP | -48% |
| Billing Specialist | 61,800 GBP | -37% |
| Billing Supervisor | 89,000 GBP | -9% |
| Bookkeeper | 37,700 GBP | -62% |
| Bookkeeping Specialist | 53,700 GBP | -45% |
| Budget Analyst | 97,100 GBP | -1% |
| Budget Manager | 114,000 GBP | +16% |
| Business Support Analyst | 64,500 GBP | -34% |
| Capital Markets Associate | 89,900 GBP | -8% |
| Cash Flow Analyst | 91,300 GBP | -7% |
| Cash Management Manager | 118,000 GBP | +20% |
| Cash Management Officer | 67,400 GBP | -31% |
| Cashbook Clerk | 40,100 GBP | -59% |
| Chartered Accountant | 73,800 GBP | -25% |
| Chief Accountant | 90,400 GBP | -8% |
| Chief Financial Technology Officer | 122,000 GBP | +24% |
| Collections Clerk | 34,900 GBP | -64% |
| Collections Representative | 50,700 GBP | -48% |
| Collections Specialist | 60,500 GBP | -38% |
| Corporate Controller | 95,500 GBP | -3% |
| Corporate Treasurer | 113,000 GBP | +15% |
| Cost Accountant | 56,000 GBP | -43% |
| Cost Accounting Manager | 116,000 GBP | +18% |
| Cost Accounting Supervisor | 96,800 GBP | -1% |
| Cost Analyst | 91,800 GBP | -6% |
| Credit and Collection Manager | 111,000 GBP | +13% |
| Credit and Collection Staff | 44,300 GBP | -55% |
| Credit and Loans Officer | 41,000 GBP | -58% |
| Credit Controller | 81,100 GBP | -17% |
| Credit Manager | 116,000 GBP | +18% |
| Debt Adviser | 93,000 GBP | -5% |
| Debt Collector | 49,300 GBP | -50% |
| Debtors Clerk | 39,000 GBP | -60% |
| Debtors Controller | 44,800 GBP | -54% |
| Deputy CFO | 163,000 GBP | +66% |
| Deputy Head of Finance | 159,000 GBP | +62% |
| Derivative Trader | 104,000 GBP | +6% |
| Director of Finance | 165,000 GBP | +68% |
| E-commerce Accountant | 63,300 GBP | -36% |
| Economist | 135,000 GBP | +38% |
| Equity Analyst | 105,000 GBP | +7% |
| Escrow Assistant | 54,300 GBP | -45% |
| Executive Accountant | 63,900 GBP | -35% |
| External Auditor | 84,000 GBP | -14% |
| Finance Administrator | 69,000 GBP | -30% |
| Finance Analyst | 103,000 GBP | +5% |
| Finance Associate | 50,700 GBP | -48% |
| Finance Data Analyst | 98,200 GBP | +0% |
| Finance Director | 169,000 GBP | +72% |
| Finance Executive | 127,000 GBP | +29% |
| Finance Licensing Clerk | 43,100 GBP | -56% |
| Finance Licensing Manager | 112,000 GBP | +14% |
| Finance Licensing Specialist | 62,700 GBP | -36% |
| Finance Manager | 158,000 GBP | +61% |
| Finance Officer | 56,200 GBP | -43% |
| Finance President | 165,000 GBP | +68% |
| Finance Relationship Manager | 140,000 GBP | +43% |
| Finance Release Analyst | 65,700 GBP | -33% |
| Finance Specialist | 92,000 GBP | -6% |
| Finance Team Leader | 126,000 GBP | +28% |
| Financial Accountant | 60,100 GBP | -39% |
| Financial Actuary | 88,500 GBP | -10% |
| Financial Administrator | 95,400 GBP | -3% |
| Financial Advisor | 110,000 GBP | +12% |
| Financial Analyst | 101,000 GBP | +3% |
| Financial Applications Specialist | 74,400 GBP | -24% |
| Financial Assistant | 47,200 GBP | -52% |
| Financial Associate | 57,000 GBP | -42% |
| Financial Claims Analyst | 76,900 GBP | -22% |
| Financial Claims Manager | 100,000 GBP | +2% |
| Financial Claims Supervisor | 101,000 GBP | +3% |
| Financial Clerk | 46,700 GBP | -52% |
| Financial Commercial Analyst | 82,800 GBP | -16% |
| Financial Compliance Analyst | 94,400 GBP | -4% |
| Financial Compliance Officer | 94,800 GBP | -3% |
| Financial Consultant | 77,500 GBP | -21% |
| Financial Controller | 89,900 GBP | -8% |
| Financial Coordinator | 52,800 GBP | -46% |
| Financial Customer Service Manager | 111,000 GBP | +13% |
| Financial Data Scientist | 110,000 GBP | +12% |
| Financial Dealer and Broker | 61,400 GBP | -37% |
| Financial Director | 173,000 GBP | +76% |
| Financial Encoder | 51,200 GBP | -48% |
| Financial Manager | 171,000 GBP | +74% |
| Financial Modelling Analyst | 104,000 GBP | +6% |
| Financial Operations Manager | 154,000 GBP | +57% |
| Financial Policy Analyst | 92,000 GBP | -6% |
| Financial Project Manager | 120,000 GBP | +22% |
| Financial Quantitative Analyst | 104,000 GBP | +6% |
| Financial Reporting Consultant | 82,800 GBP | -16% |
| Financial Reporting Manager | 113,000 GBP | +15% |
| Financial Section Head | 111,000 GBP | +13% |
| Financial Services Manager | 154,000 GBP | +57% |
| Financial Services Sales Agent | 64,600 GBP | -34% |
| Financial Technology Consultant | 90,100 GBP | -8% |
| Financial Wellness Coach | 116,000 GBP | +18% |
| FinTech Analyst | 95,600 GBP | -3% |
| Fixed Assets Administrator | 62,700 GBP | -36% |
| Forensic Accountant | 70,700 GBP | -28% |
| Fraud Detection Supervisor | 73,800 GBP | -25% |
| Fraud Prevention Manager | 120,000 GBP | +22% |
| Fund Accountant | 55,600 GBP | -43% |
| Grants Coordinator | 41,700 GBP | -58% |
| Green Finance Analyst | 87,500 GBP | -11% |
| Group Financial Manager | 160,000 GBP | +63% |
| Internal Auditor | 79,000 GBP | -20% |
| Internal Control Adviser | 94,200 GBP | -4% |
| Internal Control Officer | 51,400 GBP | -48% |
| International Tax Director | 135,000 GBP | +38% |
| Inventory Accountant | 61,200 GBP | -38% |
| Investment Advisor | 153,000 GBP | +56% |
| Investment Analyst | 111,000 GBP | +13% |
| Investment Associate | 97,100 GBP | -1% |
| Investment Broker | 93,200 GBP | -5% |
| Investment Fund Manager | 127,000 GBP | +29% |
| Investment Operations Manager | 135,000 GBP | +38% |
| Investment Underwriter | 47,700 GBP | -51% |
| Investor | 76,900 GBP | -22% |
| Investor Relations Manager | 118,000 GBP | +20% |
| KYC Team Leader | 109,000 GBP | +11% |
| Loan Processor | 46,000 GBP | -53% |
| Management Accountant | 67,200 GBP | -32% |
| Management Economist | 137,000 GBP | +40% |
| Paymaster | 46,200 GBP | -53% |
| Payroll Administrator | 75,100 GBP | -24% |
| Payroll Benefits Coordinator | 66,800 GBP | -32% |
| Payroll Billing Manager | 109,000 GBP | +11% |
| Payroll Clerk | 48,900 GBP | -50% |
| Payroll Manager | 112,000 GBP | +14% |
| Payroll Officer | 51,200 GBP | -48% |
| Payroll Specialist | 60,300 GBP | -39% |
| Payroll Supervisor | 76,800 GBP | -22% |
| Pensions Administrator | 62,100 GBP | -37% |
| Personal Financial Advisor | 88,700 GBP | -10% |
| Pricing Analyst | 101,000 GBP | +3% |
| Private Equity Analyst | 99,000 GBP | +1% |
| Project Accountant | 59,900 GBP | -39% |
| Proposal Development Coordinator | 52,200 GBP | -47% |
| Quantitative Trader | 83,000 GBP | -15% |
| Receivables Accountant | 55,100 GBP | -44% |
| Regulatory Accountant | 61,100 GBP | -38% |
| Retirement Plan Analyst | 95,500 GBP | -3% |
| Revenue Management Specialist | 97,800 GBP | -0% |
| Revenue Recognition Analyst | 109,000 GBP | +11% |
| Risk Management Director | 136,000 GBP | +39% |
| Risk Management Supervisor | 110,000 GBP | +12% |
| Staff Accountant | 55,300 GBP | -44% |
| Tax Accountant | 55,000 GBP | -44% |
| Tax Administrator | 63,700 GBP | -35% |
| Tax Advisor | 88,500 GBP | -10% |
| Tax Analyst | 87,200 GBP | -11% |
| Tax Associate | 48,700 GBP | -50% |
| Tax Consultant | 89,400 GBP | -9% |
| Tax Director | 141,000 GBP | +44% |
| Tax Examiner | 62,700 GBP | -36% |
| Tax Manager | 124,000 GBP | +26% |
| Tax Research Manager | 122,000 GBP | +24% |
| Teller | 35,100 GBP | -64% |
| Treasury Accountant | 61,100 GBP | -38% |
| Treasury Analyst | 94,500 GBP | -4% |
| Underwriter | 41,000 GBP | -58% |
| Underwriting Assistant | 37,900 GBP | -61% |
| Vice President of Finance | 164,000 GBP | +67% |

Salary Comparison By City
| City | Average Salary |
| London | 98,200 GBP |
Government vs Private Sector Salary Comparison
Where can you get paid more, working in a private company or the government? The difference between the public or government sector salaries and the private sector salaries in United Kingdom is 4% on average across all career fields.
| Private Sector | 69,700 GBP | |
| Public Sector | +4% | 72,800 GBP |
Salary Statistics and Calculation Guide
What is considered to be a good and competitive salary for the job title Finance Data Analyst in London?
A good and competitive compensation would range anywhere between 93,800 GBP and 108,000 GBP. This is a very rough estimate. Experience and education play a very huge part in the final earnings.
Gross Salary (before tax) and Net Salary (after tax)
All salary and compensation figures displayed here are gross salary figures, that is the salary before tax deductions. Because taxes may differ across sectors and locations, it is difficult to accurately calculate the net salary after tax for every career.
Base / Basic Salary
The base salary for a careers like Finance Data Analyst in London ranges from 45,200 GBP to 75,600 GBP. The base salary depends on many factors including experience and education. It is not easy to provide a figure with very little information, so take this range with a grain of salt.
What is the difference between the median and the average salary?
Both are indicators. If your salary is higher than both the average and the median then you are doing very well. If your salary is lower than both, then many people earn more than you and there is plenty of room for improvement. If your wage is between the average and the median, then things can be a bit complicated. We wrote a guide to explain all about the different scenarios.